Inducement and Sweep ICT Indicator for MT5 Download [TradingFinder]
$7.05 CAD
(It may be possible to pay only $4.45 instead of $5.00 when you
use your bCredits at checkout)
Sign up and get $15.00 bCredits free to use at checkout and another $5.00 bCredits when you make your first purchase.
More info
To learn more about bCredits, please click again on the icon or click here
Ships from
United States
Share & earn! Sign in, share this or any listing, and you’ll get commission when it sells.
Learn more
You can make your offer during the checkout process as long as you do not live in a state where marketplace facilitator tax laws exist. Check your state.
You can make your offer during the checkout process as long as you do not live in a state where marketplace facilitator tax laws exist. Check your state.
The MSIS Indicator for MetaTrader 5 (MT5) is a professional tool built for traders who want to understand how Smart Money manipulates liquidity in the market. By detecting false breakouts, price inducements, and liquidity traps, it exposes where retail traders get caught — and where institutions quietly enter. ?
? MSIS Indicator Specifications
? Categories:
ICT MT5 Indicators
Smart Money MT5 Indicators
Liquidity MT5 Indicators
?? Platform: MetaTrader 5
? Skill Level: Advanced
?? Indicator Type: Reversal
?? Timeframe: Multi-Timeframe
? Trading Style: Scalping | Day Trading
? Markets: Forex | Crypto | Stocks | Indices | Commodities
? MSIS Indicator Overview
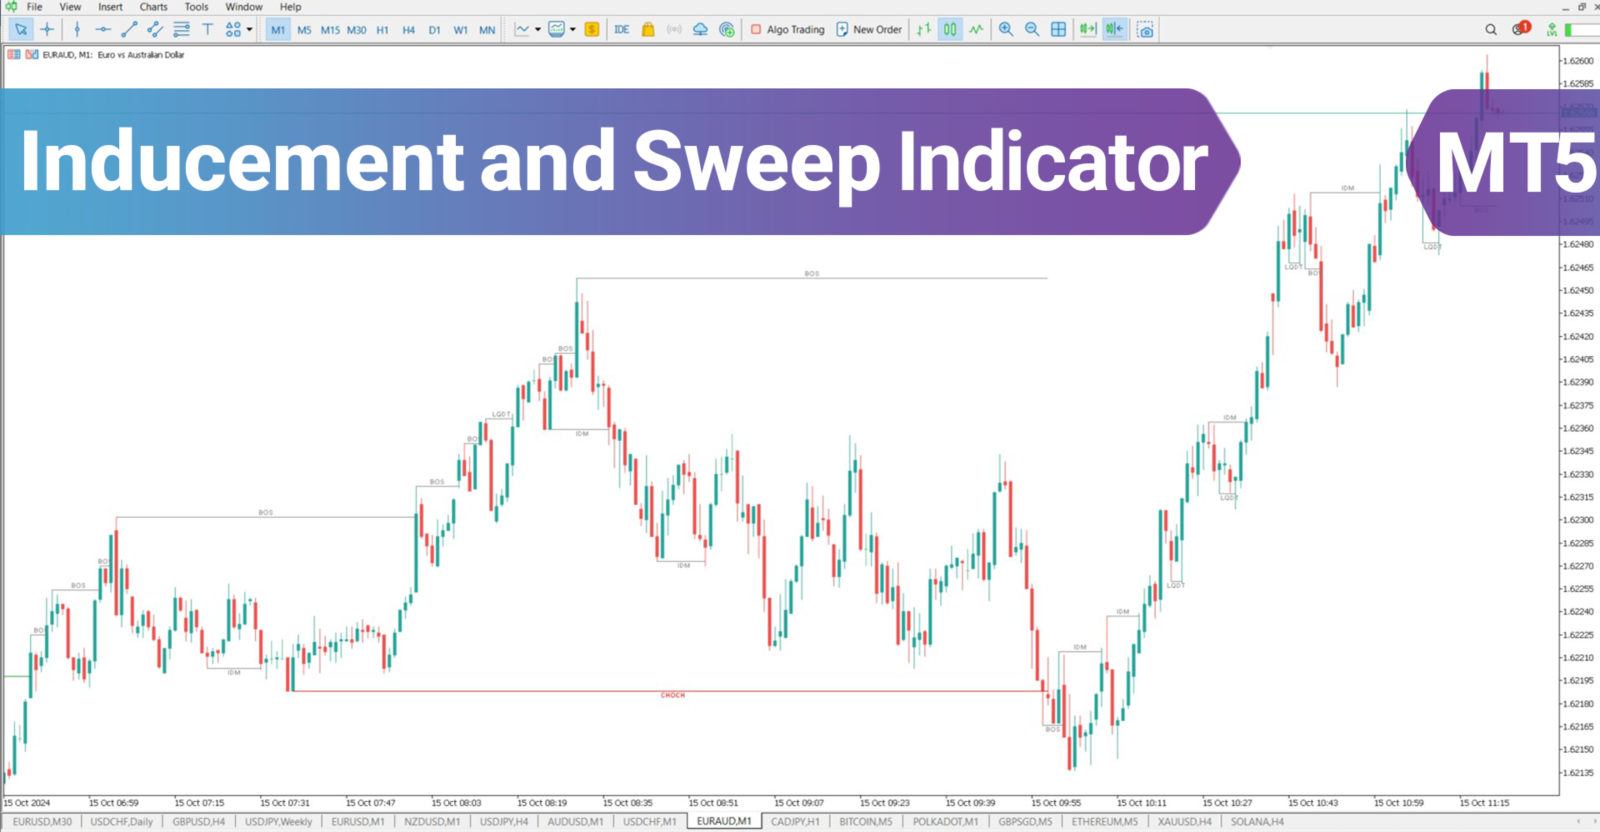
The Market Structure Liquidity Hunt (MSIS) indicator automatically highlights critical structural events such as:
Change of Character (CHoCH) ? — confirms shifts in trend direction.
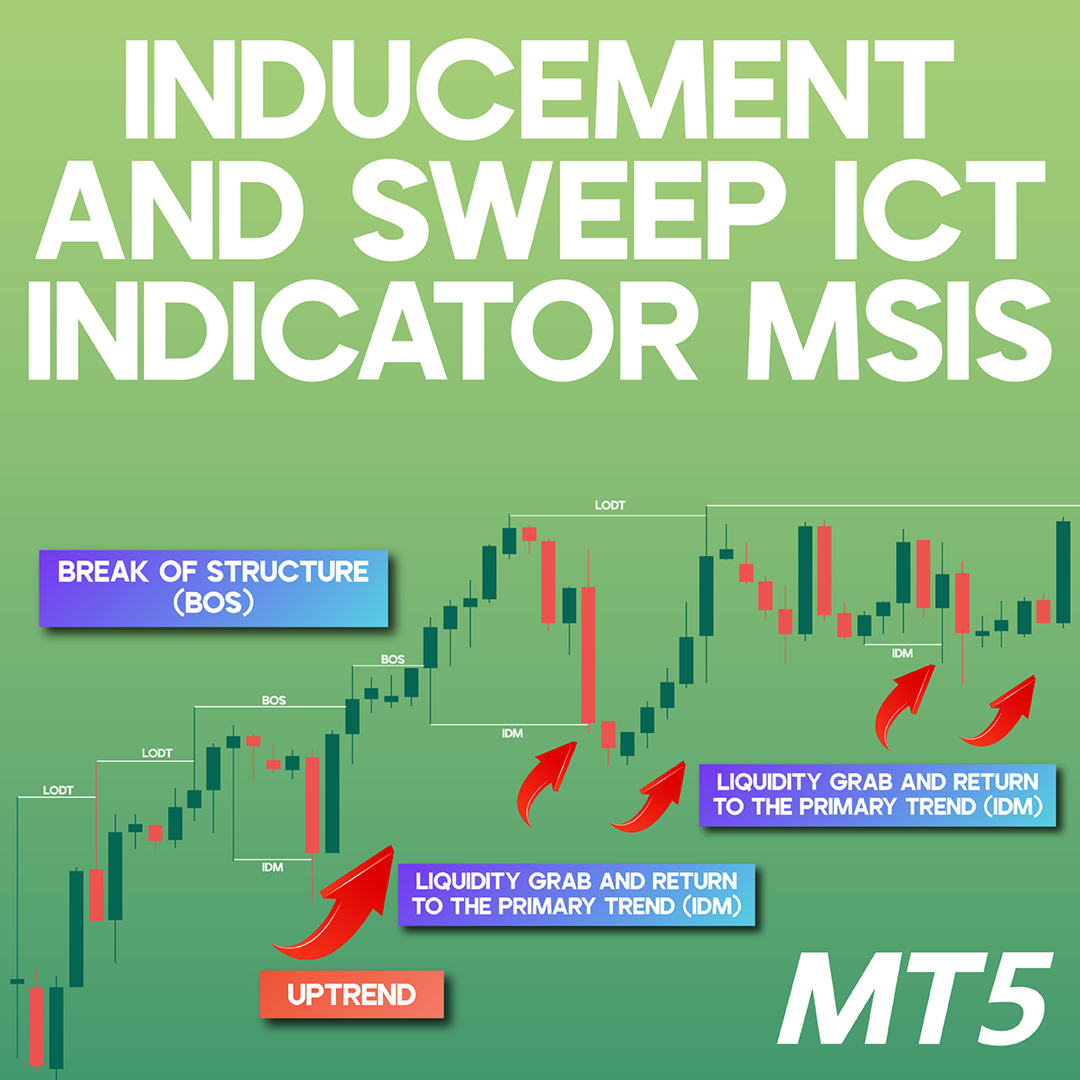
Break of Structure (BOS) ? — marks continuation or validation of trend.
Inducement (IDM) ? — identifies fake moves designed to attract liquidity.
Liquidity Zones ? — shows where stop hunts and institutional activity occur.
This combination gives traders a clear view of market manipulation, revealing where false signals form and how liquidity is collected before the real move begins. It’s ideal for Smart Money and ICT-style trading, particularly in short-term strategies such as scalping and day trading. ?
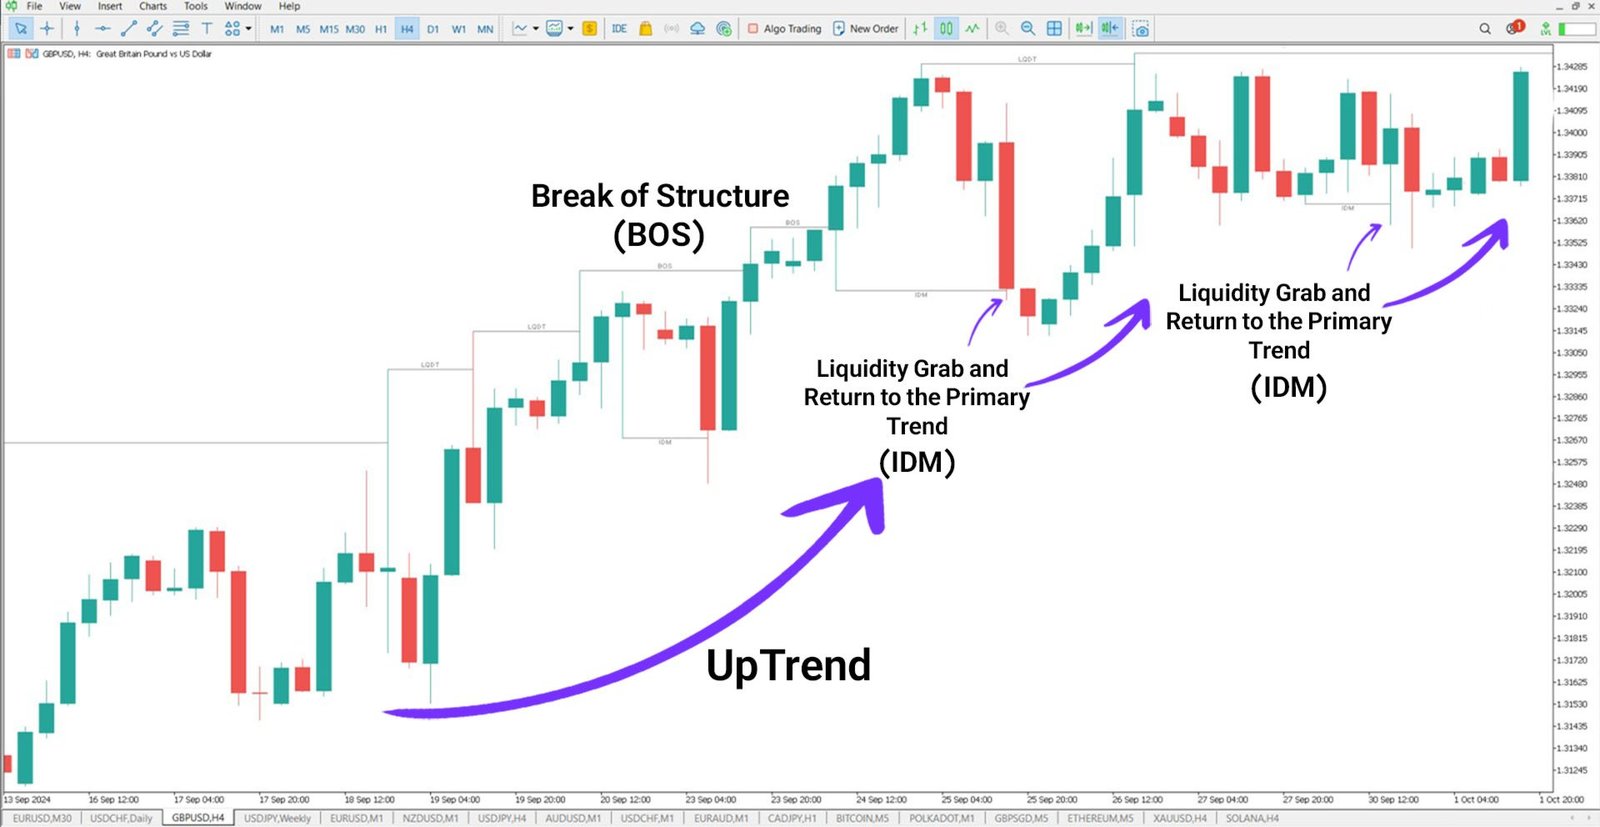
? Liquidity Hunt in an Uptrend
In an uptrend, the MSIS indicator identifies CHoCH, BOS, and IDM levels — highlighting how price sweeps liquidity before continuing upward.
On the GBP/USD 4-hour chart, after liquidity collection, the price shifts bullish, forming higher highs and higher lows. These movements allow traders to locate smart entry zones and high-probability continuation points.
? Tip: In bullish conditions, liquidity hunts often act as re-entry signals confirming institutional strength.
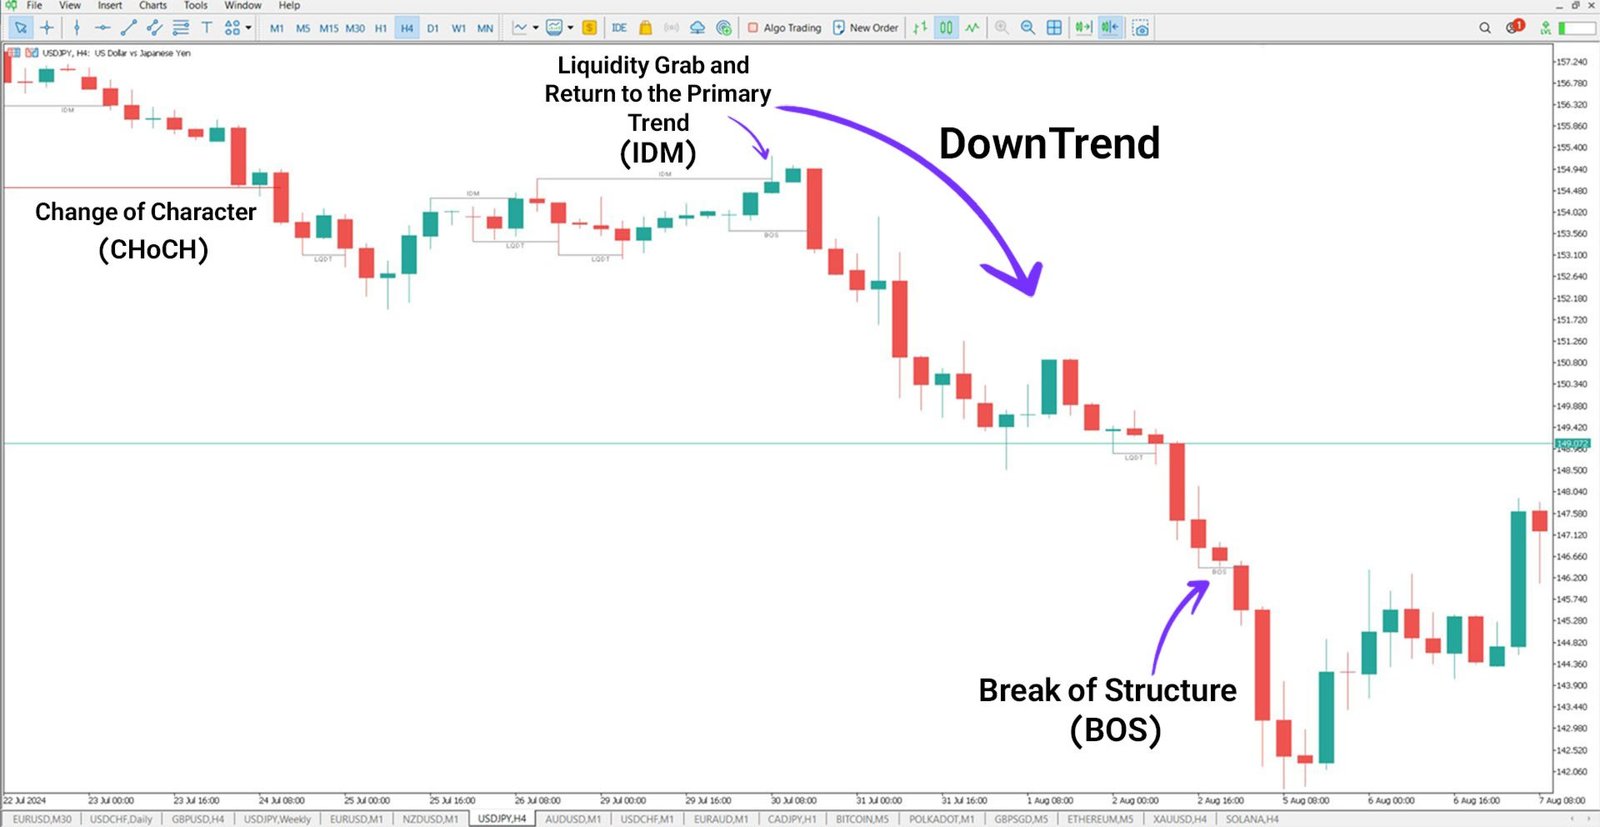
? Liquidity Hunt in a Downtrend
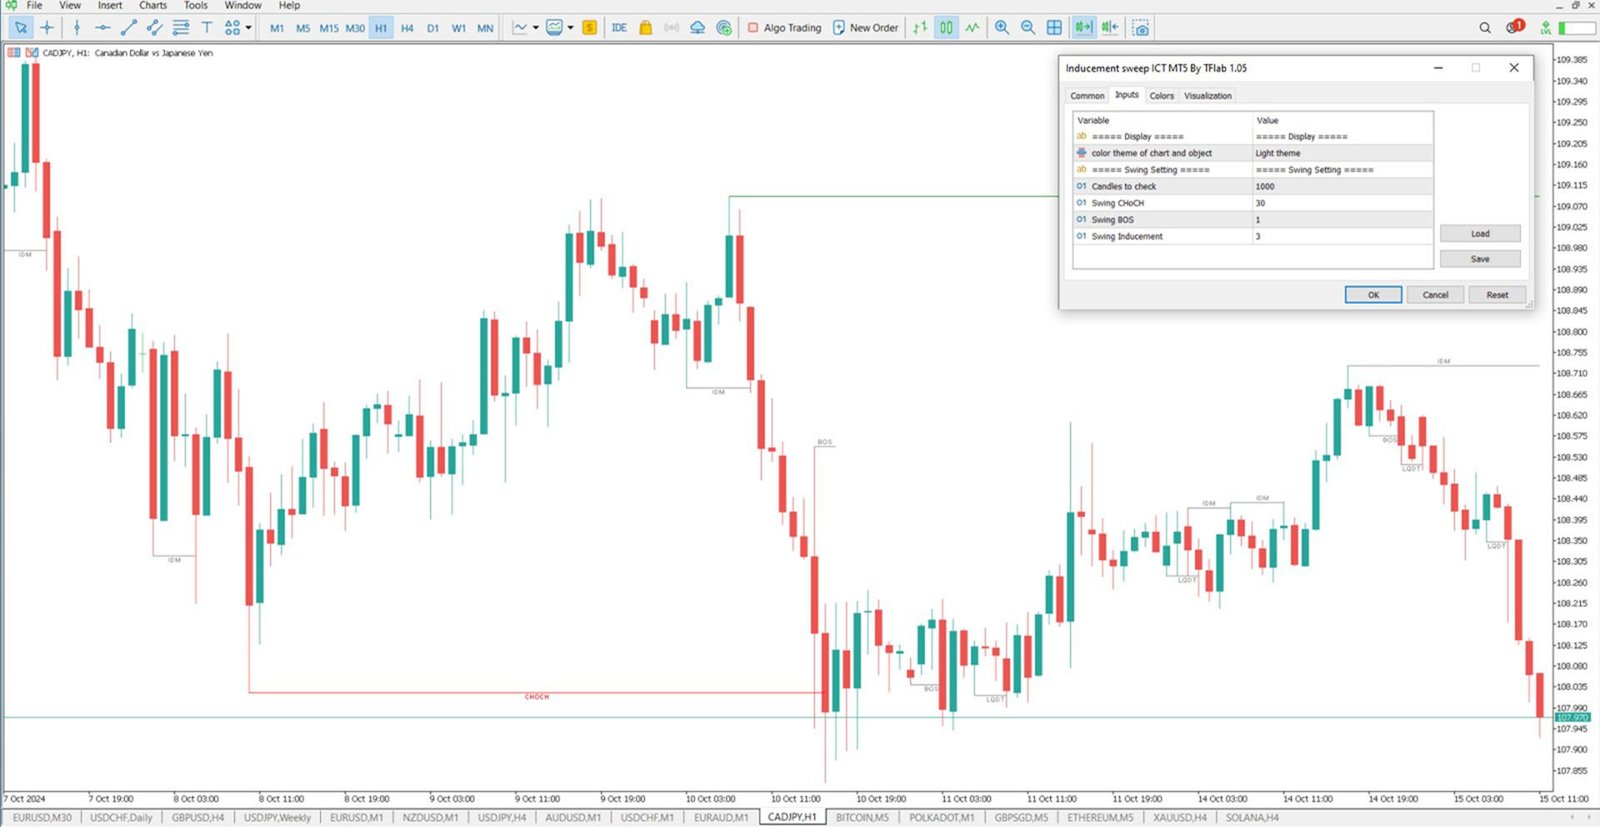
On the USD/JPY 1-hour chart, the MSIS indicator detects a Change of Character (CHoCH), signaling a shift to bearish structure. As the price sweeps above liquidity levels, false breakouts occur — luring traders into losing positions.
After trapping liquidity, price resumes the main trend downward, marking Breaks of Structure (BOS) and new inducement zones automatically.
? Tip: These sweeps often reveal stop-loss clusters that institutions target before real continuation.
?? Indicator Settings
? Chart Theme: Adjust colors for chart clarity.
?? Candles to Check: Number of bars analyzed for structure detection.
? Swing CHoCH: Determines sensitivity for Change of Character.
? Swing BOS: Defines the depth of Break of Structure identification.
? Swing Inducement: Fine-tunes inducement zone precision.
? Conclusion
The Market Structure Liquidity Hunt (MSIS) indicator helps traders uncover the hidden mechanics of price manipulation.
By combining CHoCH, BOS, Inducement, and Liquidity Zone detection, it provides an institutional-level view of how markets accumulate liquidity before making decisive moves.
Trade with clarity, follow Smart Money — and let MSIS guide you to where real opportunities begin. ?